
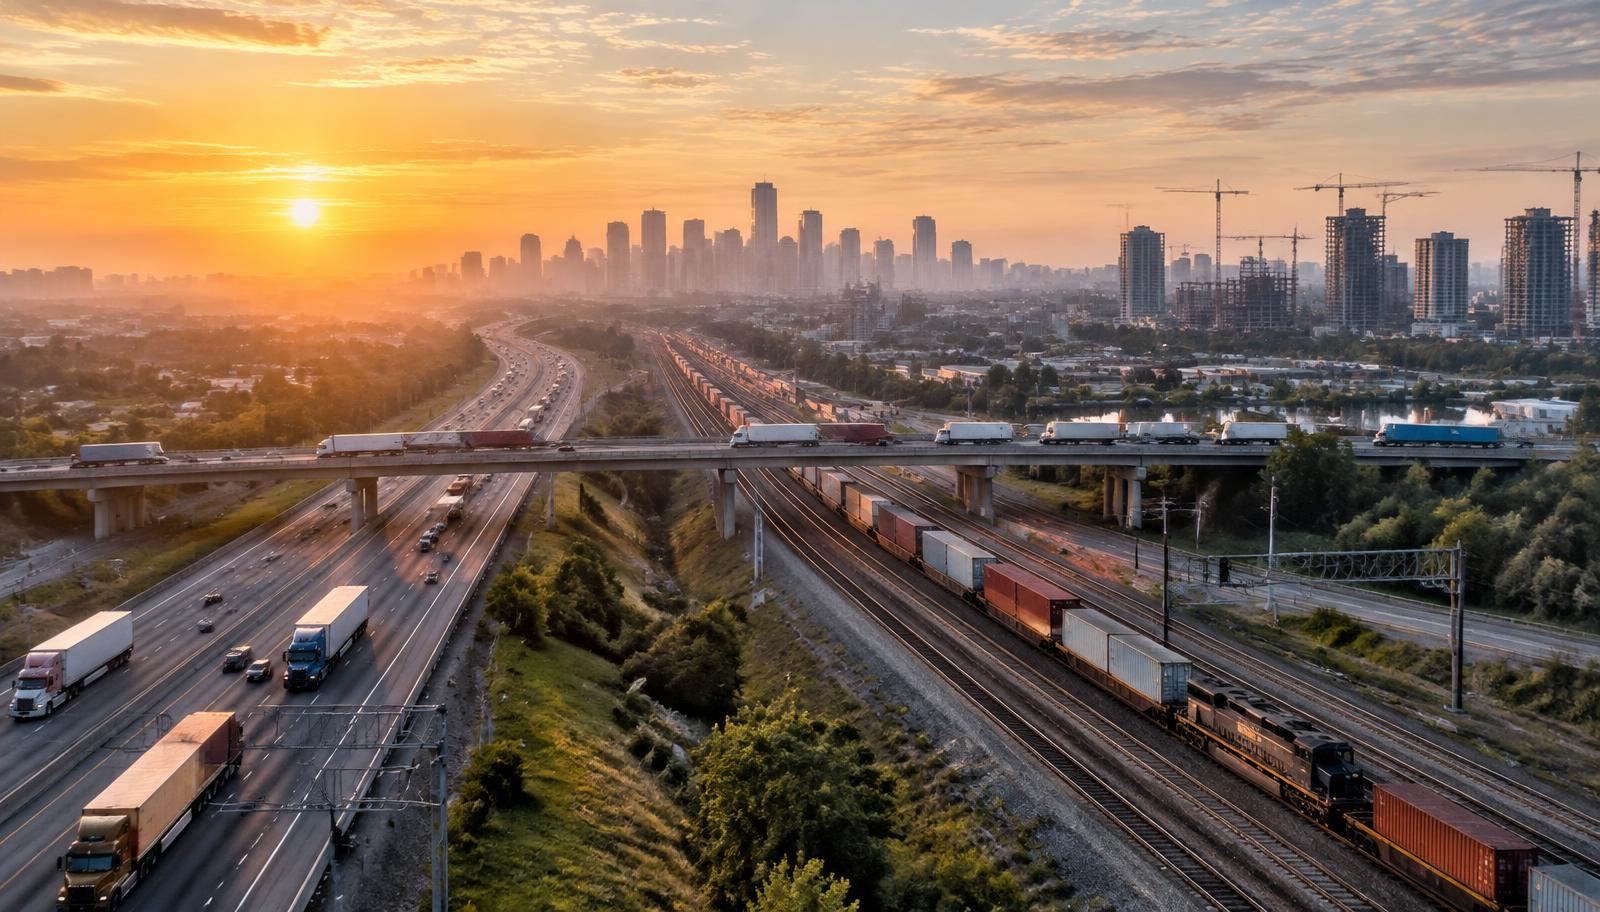
Future platform vision
Patterns in how construction actually buys.
Purchase records describe the market more directly than any survey: what is bought, at what price, in what volume, in which region, at what point in a project.
The problem
What gets in the way today.
Price opacity
Slow indices
Category confusion
Capabilities
What RavenTrack does here.
Category normalization
Comparable products grouped so pricing can be compared honestly.
Regional benchmarks
Aggregated views by geography and material category.
Trend detection
Shifts in purchasing volume and price over time.
Aggregation safeguards
Designed so individual company data is not exposed.
Regional demand vs supply signal
Future visionWest metro
Prairie corridor
Central metro
Eastern market
Conceptual visualization of how connected data could read.
Outcomes
What changes as a result.
- Better-informed purchasing and estimating.
- Earlier awareness of category-level cost movement.
- Market insight grounded in transactions.
Future platform vision. Benchmarks depend on participation and are not published today.
Talk to us about future platform vision.
Book a demo of the product as it works today, or start a conversation about what is being built next.